What it does
The maps reflect reports and model judgments, not verified hazards or population-adjusted risk. A non-AI baseline mode is also available.
Benchmarks & research
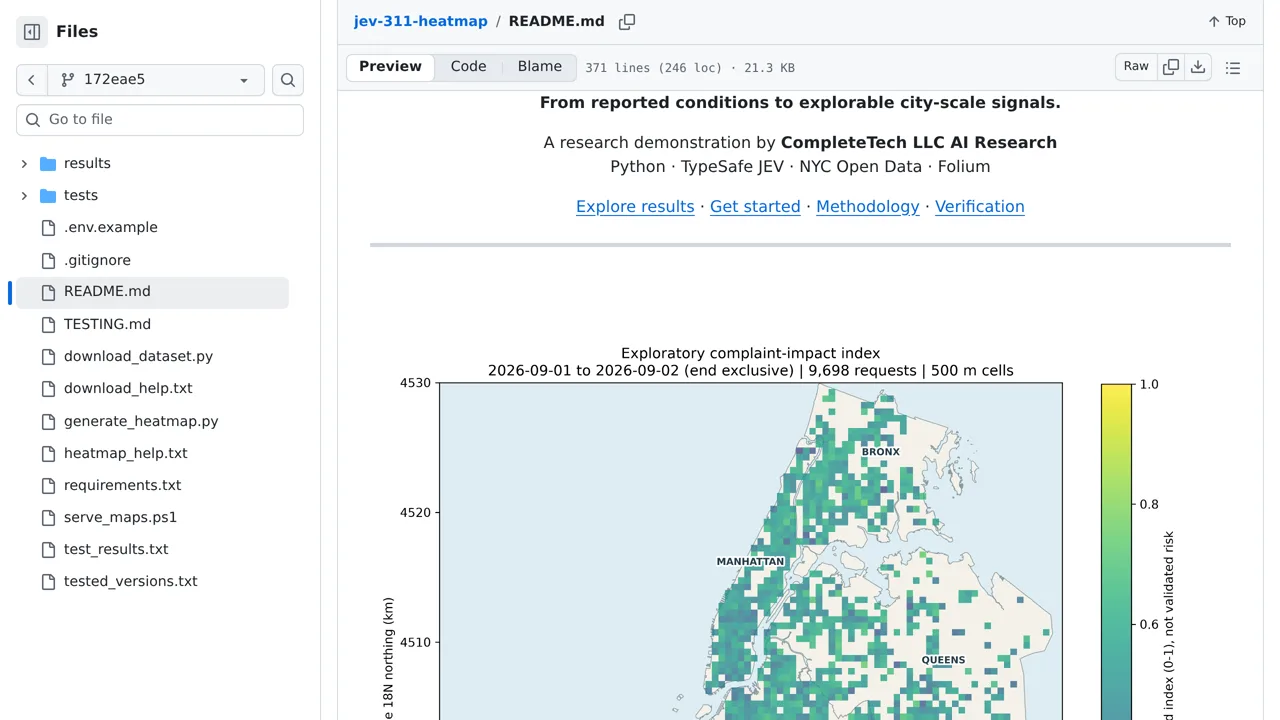
Turn NYC 311 complaint text into explorable maps of reporting volume and Jev-estimated impact.
Only you can see your notes.
Screenshot unavailable. Open the experiment ↗
The maps reflect reports and model judgments, not verified hazards or population-adjusted risk. A non-AI baseline mode is also available.
For a community-reporting project, start by exploring this demo's New York complaint maps. Compare how many reports an area has with how serious the AI thinks their descriptions sound. A developer can adapt the script for your own public reports and change its questions; changing the data or scoring rules requires code changes.
Live scoring sends complaint details to TypeSafe, an outside AI service. A non-AI mode is available too. Treat the maps as clues for further investigation, not a ranking of safe places. Reports may be wrong, scores are estimates, and an empty map square does not prove that nothing is wrong there.