JevMade

Sign in
← Back to experiments

Apps & data pipelines

Practical Data

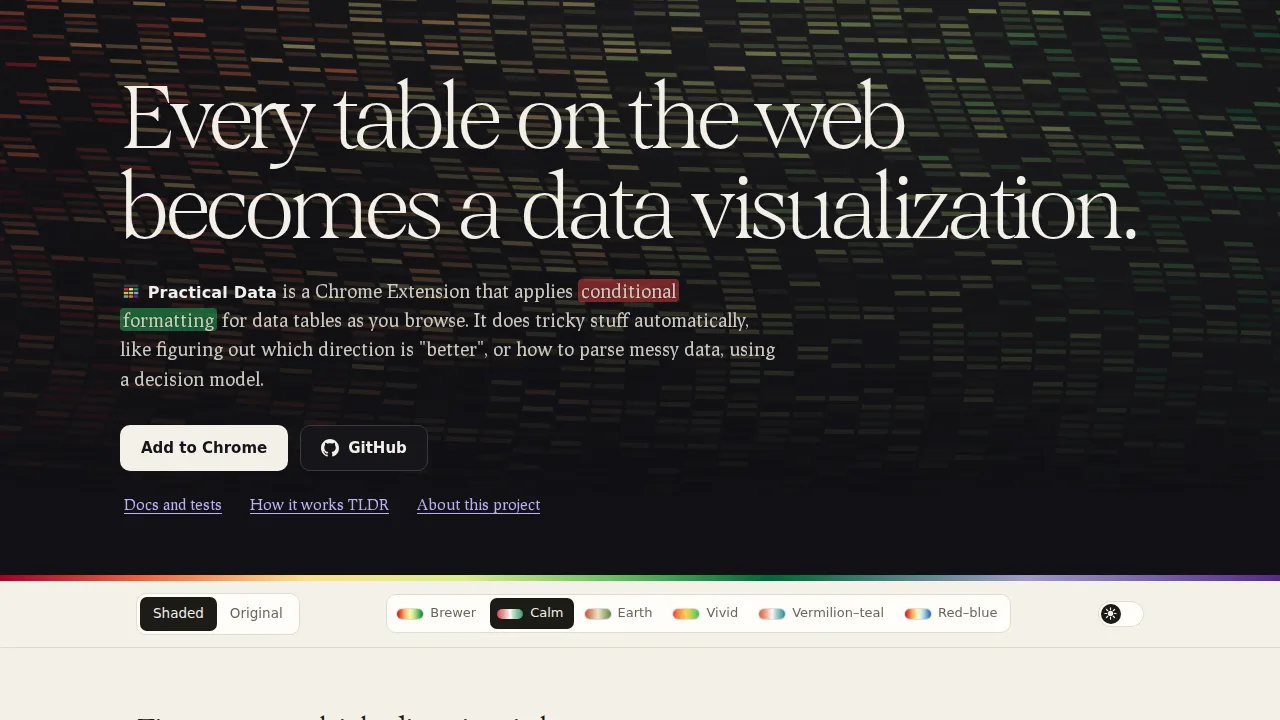
Shade the comparable columns of HTML tables on any web page, with a model deciding which columns to color and which end is better.

Source screenshot of Practical Data
SOURCE SCREENSHOTFull screenshot ↗

What it does

Table text is sent to a decision model only for tables near the viewport, and a column is shaded only when its probability is 0.7 or more. The maker's offline replay of recorded answers is a regression check tuned on the same 54 pages, not an accuracy estimate for new pages.

How you can use it

Install the extension from the Chrome Web Store, or build it from source and load the dist/ folder in Chrome's developer mode.

Scroll near a table on a web page; the extension sends the table's headers and sample values to Jev and paints the columns it judges comparable.

Hover a shaded header to see its scale, or use the toolbar popup to turn the site off; the options page lets you pick the provider and paste your own TypeSafe key.
Maker-reported (not independently measured by JevMade)

The maker reports an offline replay with Jev 1.13: color choice 541 of 543, polarity 266 of 266, log vs linear 27 of 27, ordinal order 15 of 16. · The maker reports the test corpus sends 455 requests and 1,022,149 input tokens for 54 pages, about $0.04 at Jev's price. · The maker reports the free provider allows 400 model requests per install per day, with a total daily budget of about $2.10.

Primitives
noul, choice
Platform
TypeScript
Added
Project created
GitHub stars
93 (snapshot, not live)

Keep this for later

Sign in to bookmark experiments, guides and videos, and keep notes only you can see.

Continue to sign in

We’ll bring you back to this listing.